Table of contents
No headings in the article.

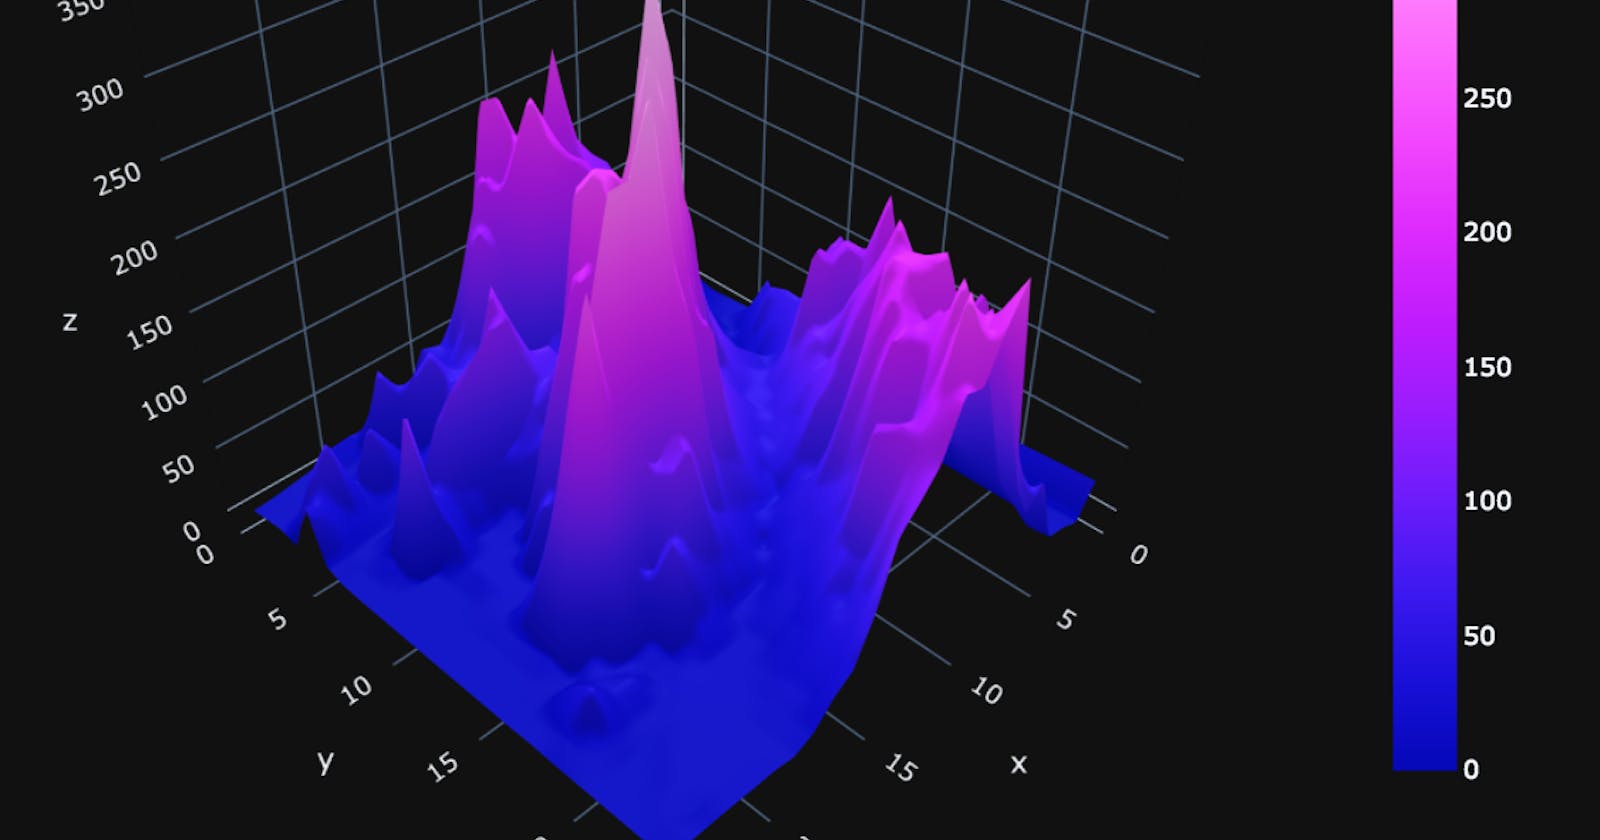
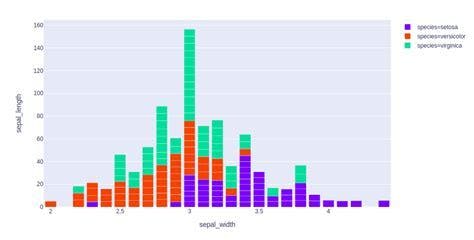
Plotly's Python graphing library makes interactive, publication-quality graphs. Examples of how to make line plots, scatter plots, area charts, bar charts, error bars, box plots, histograms, heatmaps, subplots, multiple-axes, polar charts, and bubble charts. Plotly.py is free and open source and you can view the source, report issues or contribute on GitHub.
The plotly.express module (usually imported as px) contains functions that can create entire figures at once, and is referred to as Plotly Express or PX. Plotly Express is a built-in part of the plotly library, and is the recommended starting point for creating most common figures. Every Plotly Express function uses graph objects internally and returns a plotly.graph_objects.Figure instance. Throughout the plotly documentation, you will find the Plotly Express way of building figures at the top of any applicable page, followed by a section on how to use graph objects to build similar figures. Any figure created in a single function call with Plotly Express could be created using graph objects alone, but with between 5 and 100 times more code.
Built on top of the Plotly JavaScript library (plotly.js), plotly enables Python users to create beautiful interactive web-based visualizations that can be displayed in Jupyter notebooks, saved to standalone HTML files, or served as part of pure Python-built web applications using Dash. The plotly Python library is sometimes referred to as "plotly.py" to differentiate it from the JavaScript library.
This Getting Started guide explains how to install plotly and related optional pages. Once you've installed, you can use our documentation in three main ways:
You jump right in to examples of how to make basic charts, statistical charts, scientific charts, financial charts, maps, and 3-dimensional charts. If you prefer to learn about the fundamentals of the library first, you can read about the structure of figures, how to create and update figures, how to display figures, how to theme figures with templates, how to export figures to various formats and about Plotly Express, the high-level API for doing all of the above. You can check out our exhaustive reference guides: the Python API reference or the Figure Reference
Plotly charts in Dash
Dash is the best way to build analytical apps in Python using Plotly figures. To run the app below, run pip install dash, click "Download" to get the code and run python app.py.
Jupyter Notebook Support
For use in the classic Jupyter Notebook, install the notebook and ipywidgets packages using pip:
$ pip install "notebook>=5.3" "ipywidgets>=7.5"
or conda:
$conda install "notebook>=5.3" "ipywidgets>=7.5"
These packages contain everything you need to run a Jupyter notebook...
$ jupyter notebook
and display plotly figures inline using the notebook renderer
Static Image Export
plotly.py supports static image export, using the either the kaleido package (recommended, supported as of plotly version 4.9) or the orca command line utility (legacy as of plotly version 4.9).
Kaleido
The kaleido package has no dependencies and can be installed using pip...
$ pip install -U kaleido
or conda.
$ conda install -c plotly python-kaleido
Orca
While Kaleido is now the recommended image export approach because it is easier to install and more widely compatible, static image export can also be supported by the legacy orca command line utility and the psutil Python package.
These dependencies can both be installed using conda:
conda install -c plotly plotly-orca==1.3.1 psutil
Or, psutil can be installed using pip...
pip install psutil
and orca can be installed according to the instructions in the orca README
Extended Geo Support
Some plotly.py features rely on fairly large geographic shape files. The county choropleth figure factory is one such example. These shape files are distributed as a separate plotly-geo package. This package can be installed using pip...
$ pip install plotly-geo==1.0.0
or conda.
$ conda install -c plotly plotly-geo=1.0.0
See USA County Choropleth Maps in Python for more information on the county choropleth figure factory.
Chart Studio Support
The chart-studio package can be used to upload plotly figures to Plotly's Chart Studio Cloud or On-Prem services. This package can be installed using pip...
$ pip install chart-studio==1.1.0
or conda.
$ conda install -c plotly chart-studio=1.1.0
Written by : Deepshikha Niyogi


