How Image Processing Revolutionizes Data Science (Day -4)

#Day 4: Mixing, Coloring, and Thresholding with Anime Team
Introduction:
Welcome back, image warriors! Today, we delve deeper into the realm of image processing with our anime team. Just like assembling a squad of diverse abilities, we'll learn how to mix, colorize, and apply thresholding to images. Prepare to unlock new dimensions of creativity as we harness the power of pixels!
Before diving into code see Two Important Terms :
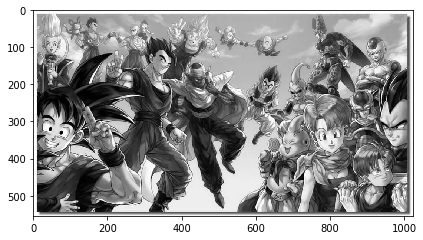
- Grayscaling:
Grayscaling is the process of converting an image from its original color space (usually RGB or BGR) to grayscale. In grayscale images, each pixel is represented by a single value indicating the intensity of brightness, ranging from black (0) to white (255).
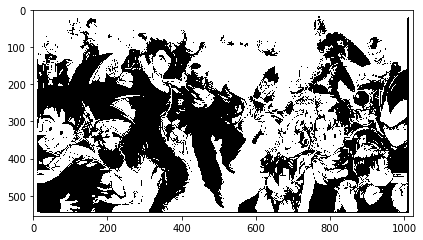
Thresholding:
Thresholding is a technique used to create binary images by dividing an image into two regions (foreground and background) based on a specified threshold value. Pixels with intensities above the threshold are set to one value (often white), while those below are set to another value (often black).
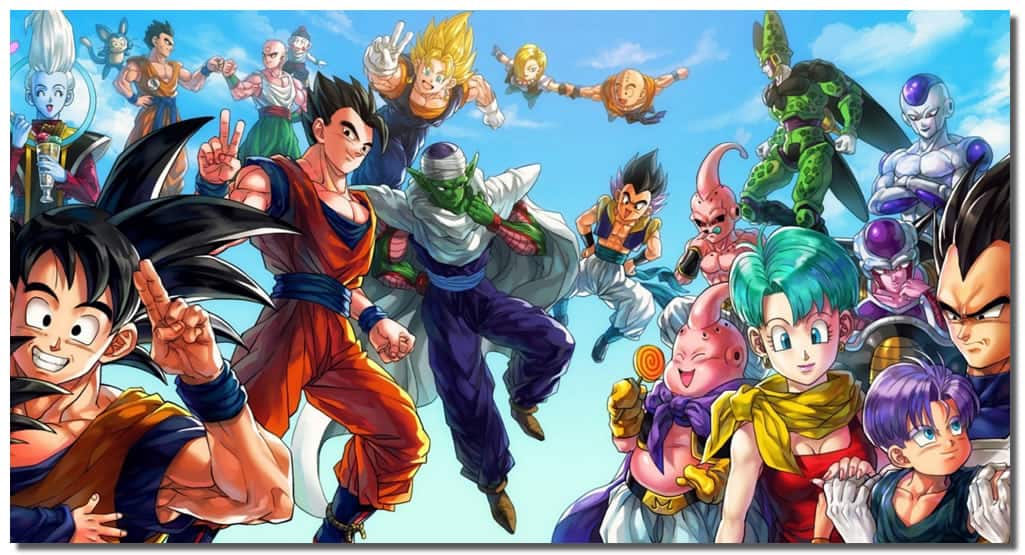
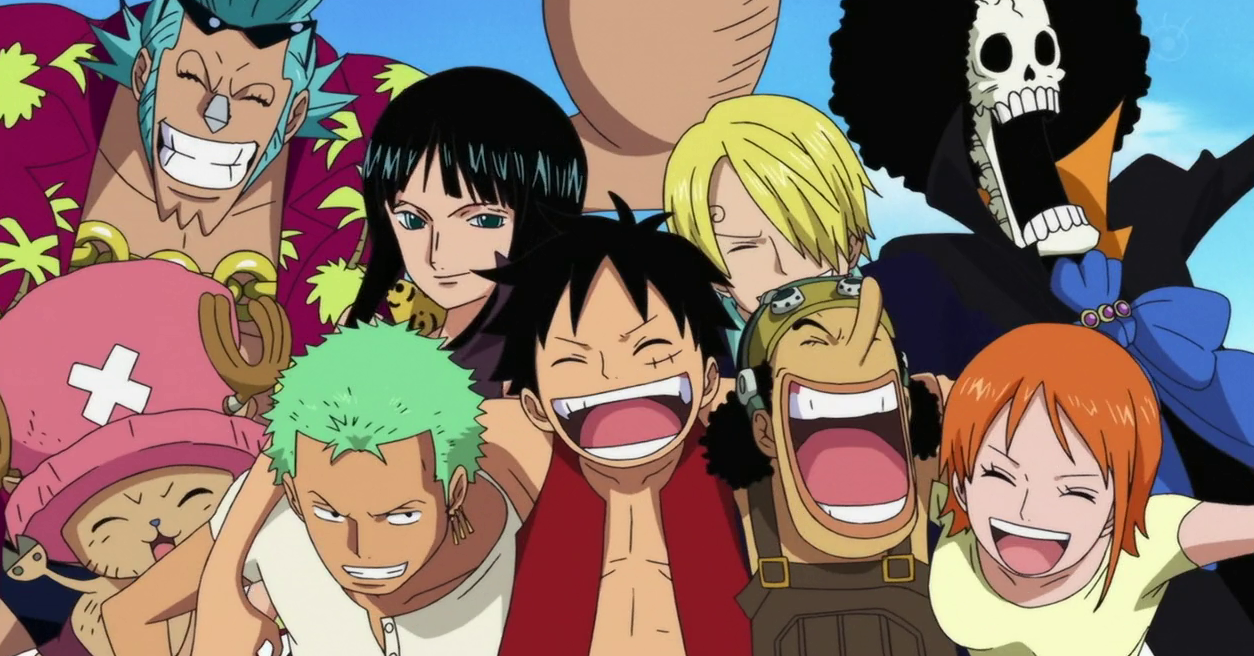
Two Input Image for Experiment:
Code Implementation:
Let's start by importing the necessary libraries and loading our images:
import cv2
import numpy as np
import matplotlib.pyplot as plt

# Load the images
img = cv2.imread('../input/tanjirosanexp-4/M032-1p-1__23801.jpg')
img1 = cv2.cvtColor(img, cv2.COLOR_BGR2RGB)
img2 = cv2.resize(img1, (1000, 500))

img3 = cv2.imread('../input/tanjirosanexp-4/strongest-anime-teams.png')
img4 = cv2.cvtColor(img3, cv2.COLOR_BGR2RGB)
img5 = cv2.resize(img4, (1000, 500))
cv2.imread(): Loads the images from the specified file paths. It reads the image in BGR format.
cv2.cvtColor(): Converts the images from BGR to RGB format because Matplotlib expects RGB images.
cv2.resize(): Resizes the images to the specified dimensions.
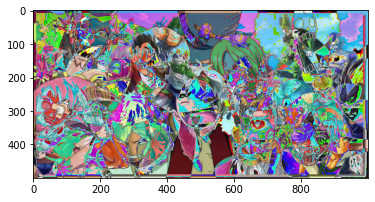
#Mixing Images:
Now, let's explore different methods to mix two images together. We'll start by using simple addition:
- cv2.imread(): Loads the images from the specified file paths. It reads the image in BGR format.
# Simple addition of images
add = img2 + img5
plt.imshow(add)
plt.show()
cv2.cvtColor(): Converts the images from BGR to RGB format because Matplotlib expects RGB images.
cv2.resize(): Resizes the images to the specified dimensions.
Next, let's use OpenCV's add() function for mixing:
# Mixing images using OpenCV add function
add = cv2.add(img5, img2)
plt.imshow(add)
plt.show()
Uses OpenCV's
add()function to mix the two images.This function adds pixel values, but it saturates the result if it exceeds 255 (white).
Matplotlib's
imshow()function displays the resulting image.
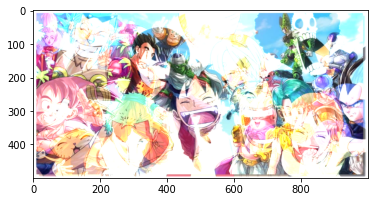
#Colorizing Images:
To blend images with different weights, we'll use OpenCV's addWeighted() function:
# Colorizing images with different weights
w = cv2.addWeighted(img2, 0.5, img5, 0.5, 0)
plt.imshow(w)
plt.show()
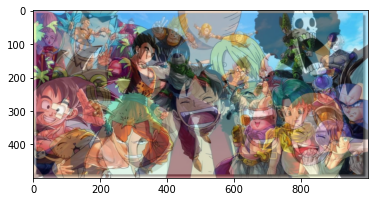
Uses OpenCV's
addWeighted()function to blend the images with different weights.The first two parameters are the input images, and the next two parameters are their respective weights.
The last parameter is a scalar added to the weighted sum, if needed.
Matplotlib's
imshow()function displays the resulting image.
#Thresholding:
Lastly, let's apply thresholding to convert our image into a binary form:
# Thresholding to create a binary image
gray_image = cv2.cvtColor(img, cv2.COLOR_BGR2GRAY)
ret, mask = cv2.threshold(gray_image, 110, 255, cv2.THRESH_BINARY)
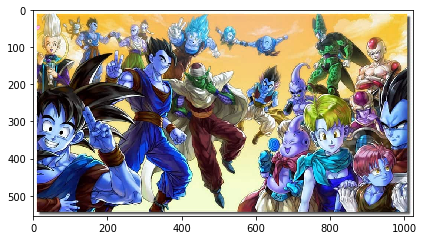
# Plotting the original, grayscale, and thresholded images
plt.figure(figsize=(10, 5))
plt.subplot(131)
plt.imshow(img1)
plt.title('Original Image')
cv2.cvtColor()is a function from OpenCV used to convert the color space of an image.imgis the original image loaded using OpenCV.cv2.COLOR_BGR2GRAYspecifies the conversion from the BGR color space (commonly used in OpenCV) to grayscale.gray_imagestores the resulting grayscale image.cv2.threshold()is a function used to apply thresholding to an image.gray_imageis the grayscale image obtained previously.110is the threshold value. Pixels with intensity values above this threshold will be set to255(white), and those below will be set to0(black).retis a return value indicating the chosen threshold (in this case, it's not used).maskstores the resulting binary image.
plt.subplot(132)
plt.imshow(gray_image, cmap='gray')
plt.title('Grayscale Image')
plt.subplot(133)
plt.imshow(mask, cmap='gray')
plt.title('Thresholded Image')

plt.show()
Conclusion:
Congratulations! You've now mastered the art of mixing, coloring, and thresholding images with your anime team. Just like orchestrating a symphony, manipulating pixels opens endless possibilities for creativity. Stay tuned for more adventures in the world of image processing, where every pixel tells a story!
Keep Learning and Keep update for next Blog 😉