Anomaly Detection is the technique of identifying rare/abnormal events or observations which are different from the rest of the observations. Such “anomalous” behavior typically translates to a problem like credit card fraud, a failing machine in a server, a cyber attack, etc.
An anomaly can be broadly categorized into three categories –
Point Anomaly: A point in a dataset is said to be a Point Anomaly if it is far off from the rest of the data.
Contextual Anomaly: An observation or group of points is a Contextual Anomaly if it is an anomaly because of the context of the observation.
Collective Anomaly: A set of data instances that help in finding an anomaly.
Anomaly detection can be done by using Machine Learning. It can be done in the following ways –
Supervised Anomaly Detection: This method requires a labeled dataset containing both normal and anomalous samples to construct a predictive model to classify future data points. The most commonly used algorithms for this purpose are supervised Neural Networks, SVM(support vector machine), KNN(K-nearest neighbor)etc.
Unsupervised Anomaly Detection: This method requires a training dataset and instead assumes two things about the data ie Only a small percentage of data is anomalous and any anomaly is statistically different from the normal samples. Based on the above assumptions, the data is then clustered using a similarity measure and the data points which are far off from the cluster are anomalies.
We now demonstrate the process of anomaly detection on an attendance dataset using the K-means algorithm.
Importing python libraries:
import numpy as np
import pandas as pd
from sklearn import preprocessing
import matplotlib.pyplot as plt
#sklearn imports
from sklearn.cluster import KMeans #K-Means Clustering
from sklearn.decomposition import PCA #Principal Component Analysis
from sklearn.manifold import TSNE #T-Distributed Stochastic Neighbor Embedding
from sklearn.preprocessing import StandardScaler #used for 'Feature Scaling'
#plotly imports
import plotly as py
import plotly.graph_objs as go


from plotly.offline import download_plotlyjs, init_notebook_mode, plot, iplot
After pre-processing the dataset we removed holidays to use K-means clustering and label encoded the data points.
Now we go for K-means clustering-
#initialize the class object
kmeans = KMeans(n_clusters= 2)
#predict the labels of clusters.
#label = kmeans.fit_predict(kdf)
#Fit our model
kmeans.fit(kdf)
#Find which cluster each data-point belongs to
clusters = kmeans.predict(kdf)
print(clusters)
#Add the cluster vector to our DataFrame, X
kdf["Cluster"] = clusters
#PCA with two principal components
pca_2d = PCA(n_components=2)
#This DataFrame contains the two principal components that will be used
#for the 2-D visualization mentioned above
PCs_2d =pd.DataFrame(pca_2d.fit_transform(kdf.drop(["Cluster"], axis=1)))
PCs_2d.columns = ["PC1_2d", "PC2_2d"]
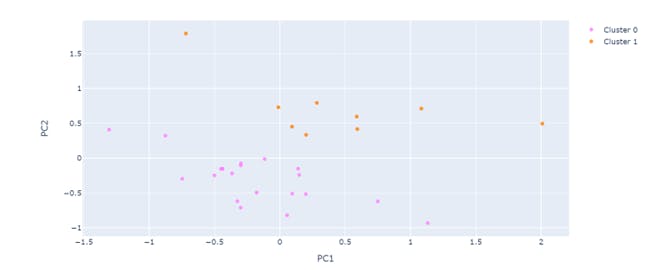
now instructions for building the 2-D plot
#trace1 is for 'Cluster 0'
trace1 = go.Scatter(
                    x = cluster0["PC1_2d"],
                    y = cluster0["PC2_2d"],
                    mode = "markers",
                    name = "Cluster 0",
                    marker = dict(color = 'rgba(255, 128, 255, 0.8)'),
                    text = None)
#trace2 is for 'Cluster 1'
trace2 = go.Scatter(
                    x = cluster1["PC1_2d"],
                    y = cluster1["PC2_2d"],
                    mode = "markers",
                    name = "Cluster 1",
                    marker = dict(color = 'rgba(255, 128, 2, 0.8)'),

                    text = None)
data = [trace1, trace2]
layout = dict(title = title,
              xaxis= dict(title= 'PC1',ticklen= 5,zeroline= False),
              yaxis= dict(title= 'PC2',ticklen= 5,zeroline= False)
)
fig = dict(data = data, layout = layout)
iplot(fig)
Data Visualization :

Now we saw that some points are very far from the other points. Those are the anomalies.

