5 Statistical Concepts for Data Scientists
Know about some statistical concepts that will help you on your journey as a data scientist or analyst
Statistics are one of the major component of data scientists’ job description. Knowing statistics is specially important when it comes to making conclusions about data or models, avoiding common pitfalls that we can fall into when building models or analysis.
There are three arguments that provide a contrarian view on discarding statistics:
Most problems are not solved using state-of-art AI.
Most organizations aren’t ready to retrain models every single day.
Statistics is the science that studies generalization ability and to make estimations and assumptions about data that you don’t have.
In this post, we are going to discuss 6 statistical concepts that data scientists may study to improve their statistical knowledge and dive deeper into the beauty of the statistical world.
Data Distributions
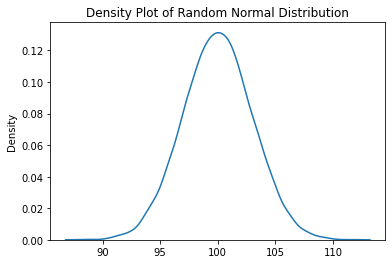
Most variables follow a specific data distribution. You have probably seen random variables that look like the following, when plotted:

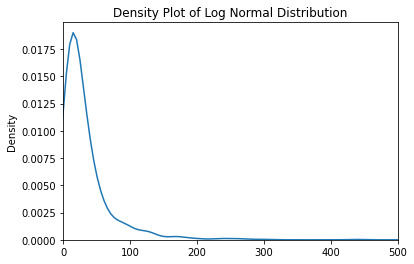
This is the famous bell curve that represents the normal distribution. But there are many others, such as the log-normal distribution:

Distributions are characterized by parameters that define their shape. Additionally, the type of variable (continuous or discrete) is another important feature that defines the expected behavior and the values that the variable can take.
CLT (Central Limit Theorem)
The Central Limit Theorem(CLT) is a pretty powerful rule that will help you understand a population’s mean based on randomly drawn samples. Basically, if you have a variable x and you want to discover the real mean of the variable (μ), you can record the mean of smaller samples (recommended at least n=30) and those sample means will have an approximate normal distribution with average similar to the population’s μ.
This rule stands no matter what the underlying population distribution is. For instance, if the distribution is log-normal and you draw random samples from that variable, the mean of sample means will also tend to the real population μ!
For the CLT to hold, there are some assumptions that one must take into account when drawing samples from the population:
Samples must be random from the population. If you draw a biased sample (for example, only a filtered portion based on a variable), the CLT does not hold for the entire population.
n ≥ 30. If you are sure the underlying data distribution is normal, you can even use less data.
Samples are independent.
Correlation vs Causation
If you work in the data industry, you’ve probably heard this a million times. Understanding this statement is fundamental for data scientists. In an age where finding spurious correlations is at the distance of a couple of lines of code, understanding the impact of saying that something causes something else is even more important.
Sure, for some projects, that’s not an issue. But most of the times, when you are in a data project, there’s a need to know why phenomenon's are connected, not only how they are connected.
By digging a bit more into the data you notice that there’s a third variable that explains this behavior — the company was calling customers because they had some issues with their service in the first place, and this was the reason why they were churning!
Central Tendency and Dispersion
Two variables may have exactly the same mean but differ enormously in the range of their values. Understanding this is key to understand sampling and comparing how two samples differ one from the other.
Central tendency and dispersion are two extremely important characteristics of data distributions. The central tendency can be measured with different metrics such as mean, median or mode and the dispersion can be measured by the standard deviation or variance. By knowing these two parameters and the distribution type, you will be able to partially visualize the shape of the distribution and how the random variable flows around it’s expected value.
Discovering these two arguments will be important to understand how one expects a random variable to behave in the future, particularly when it comes to compare between samples or understand how similar the data is. For instance, in the context of data science, understanding central tendency and dispersion will help you work around expected values and create some robust outlier detection techniques.
P-Values
A p-value is the probability that we have observed a certain value in a statistical test given that the null hypothesis is true.
P-values are pretty important to understand statistical hypothesis tests and can be summarized in a sentence: “how likely would I be looking at this p-value, if my null hypothesis was true?”. On statistical tests, you normally aim for low p-values that reject your null hypothesis.
One important thing: as the p-value is tied to testing things about the null hypothesis, the p-value does not imply validity about the alternative hypothesis.
